Finally, a cost tool built for engineers. Explore multi-cloud spend with full context — usage, deploys, incidents. No more switching between billing consoles and spreadsheets.
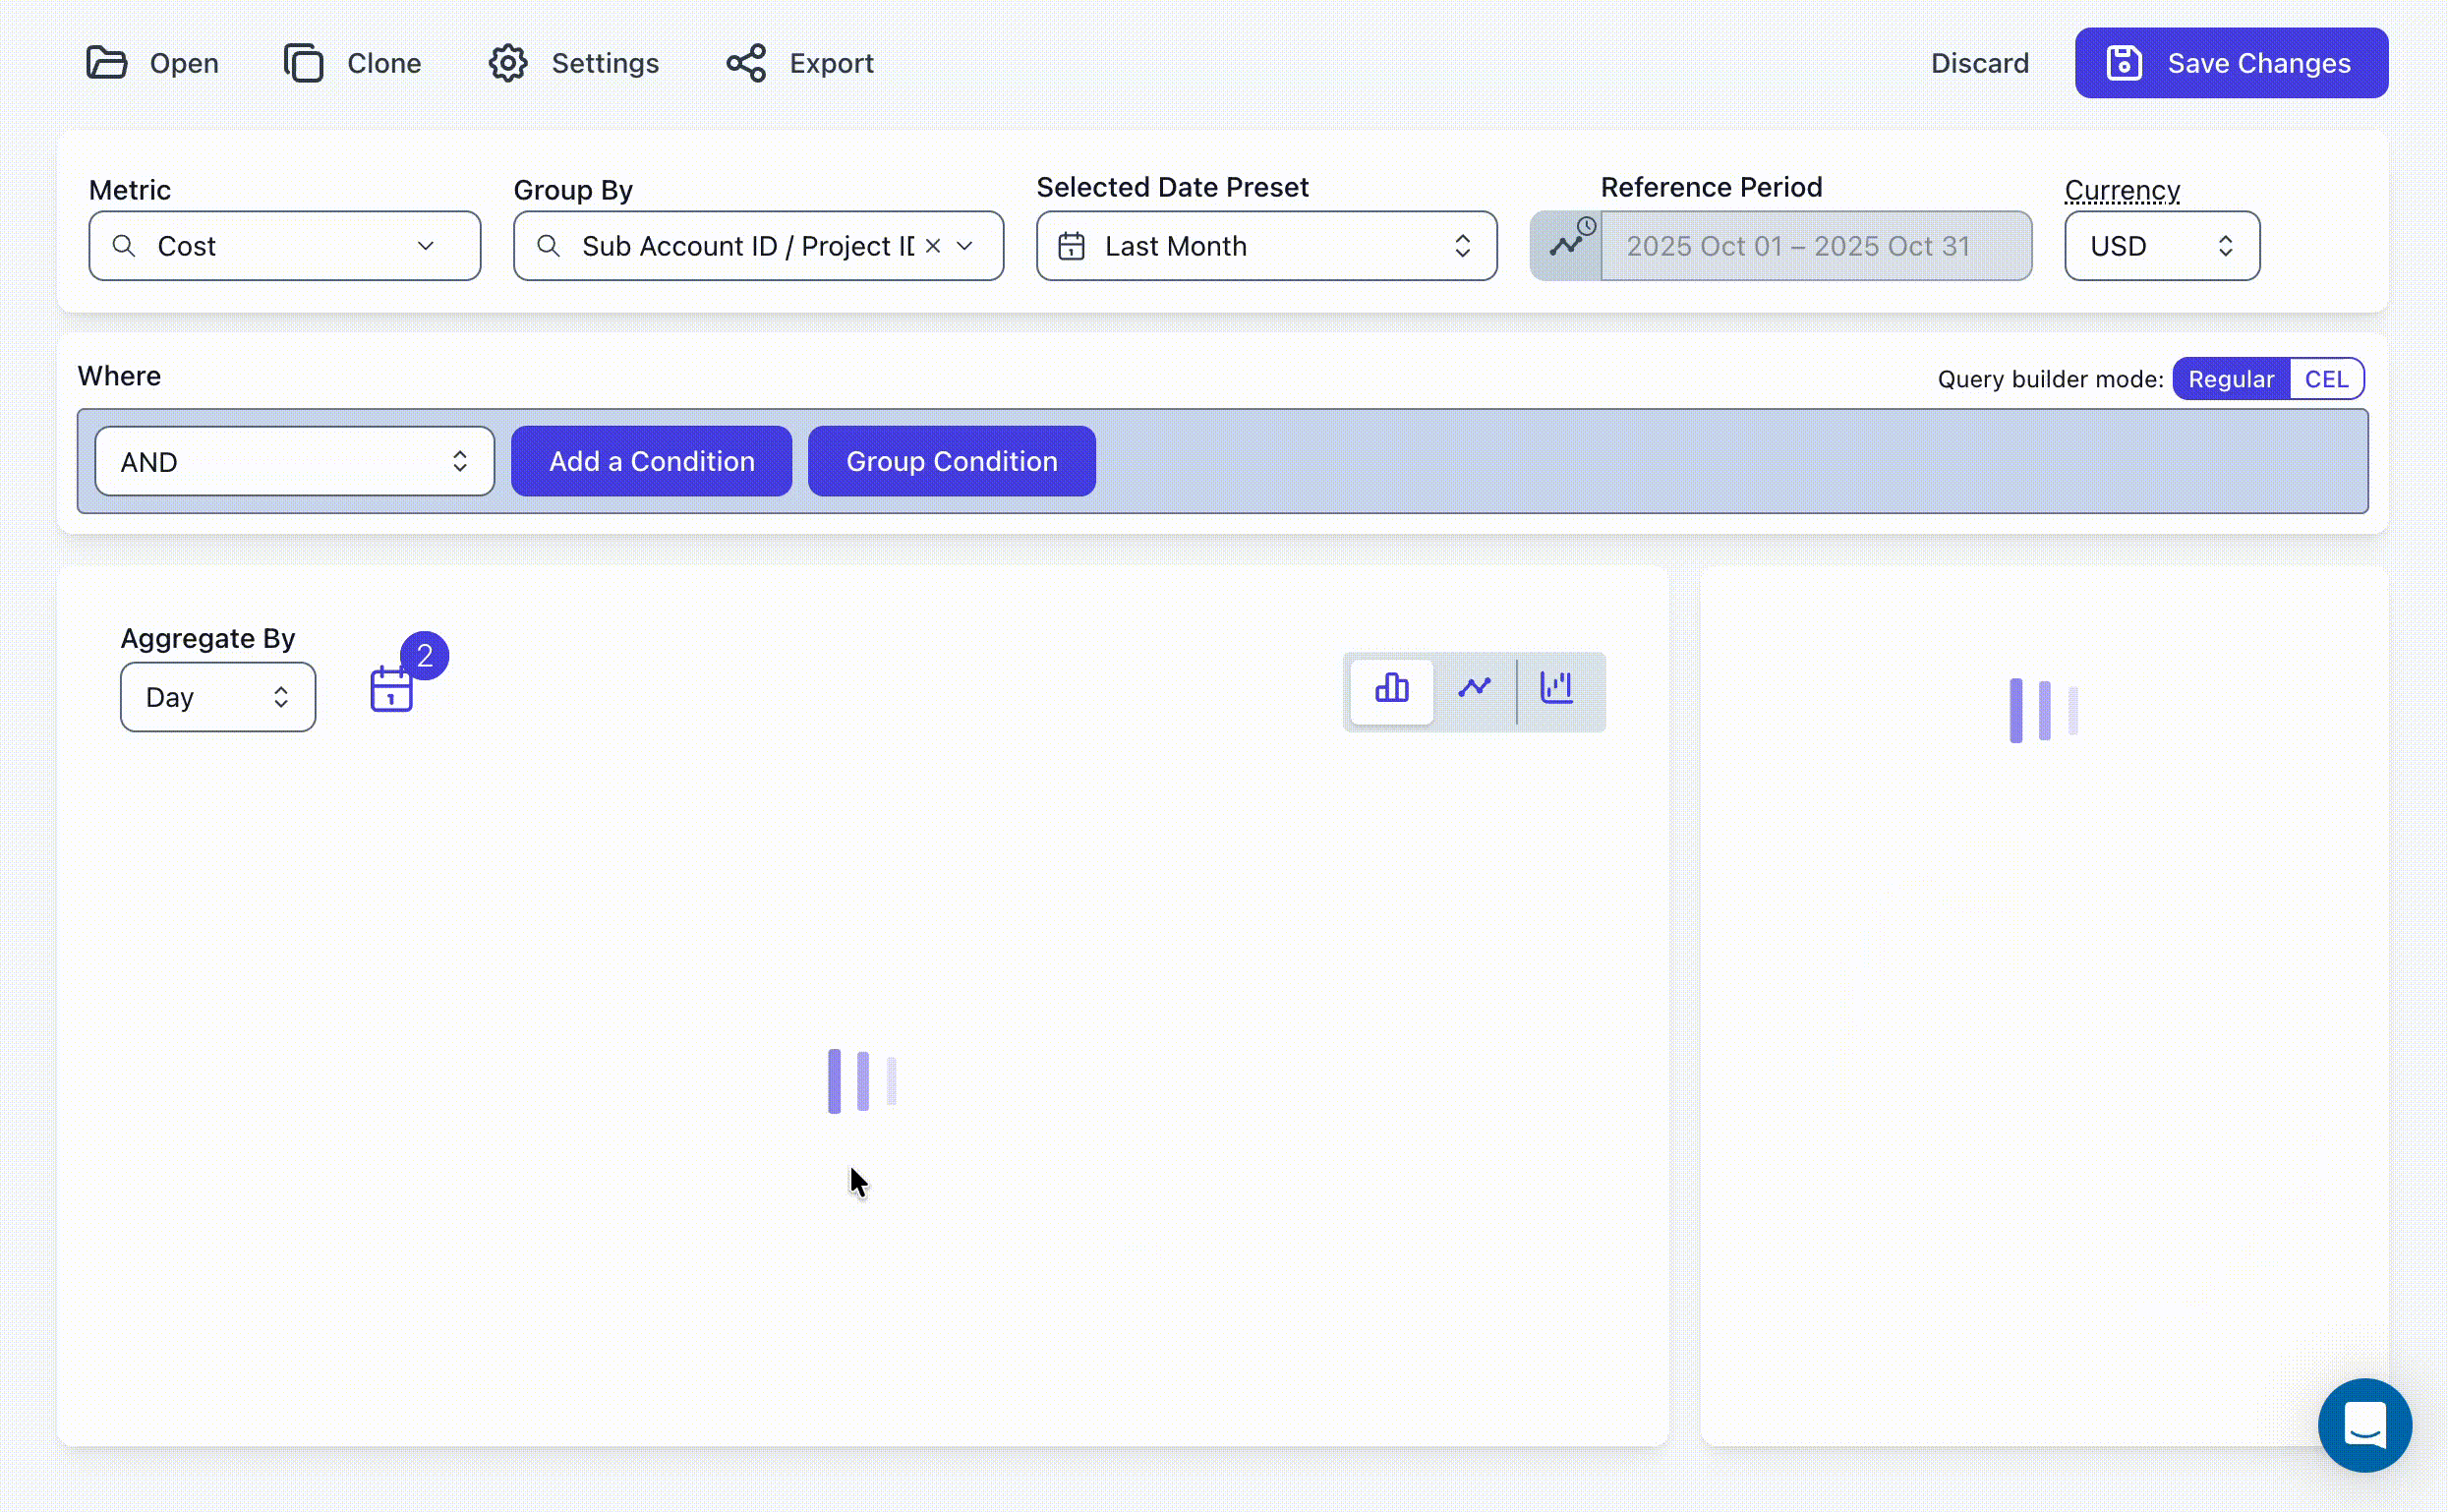
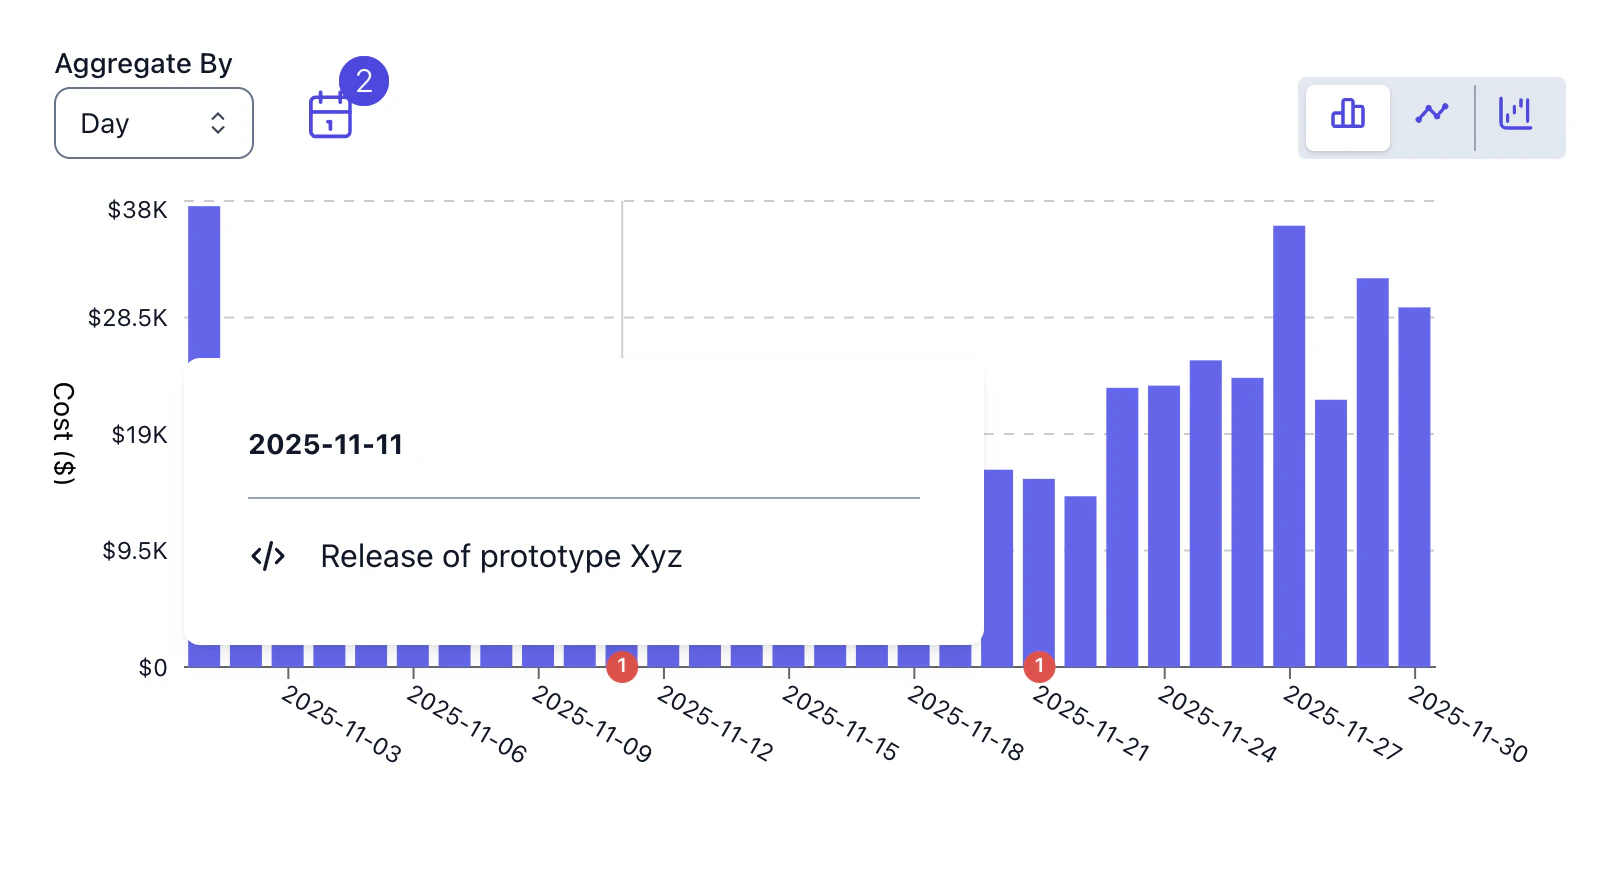
Explorer supports flexible aggregations by date (daily, weekly, monthly), grouping by all native cloud labels as well as custom labels you define in Costory, and event overlays to see how events correlate with costs.